Technical Indicators and Oscillators
From MTHWiki
Overview
A technical indicator is a series of data points that are derived by applying a formula to the price data of a security. Price data includes any combination of the open, high, low or close over a period of time. Some indicators may use only the closing prices, while others incorporate volume and open interest into their formulas. The price data is entered into the formula and a data point is produced.
A technical indicator offers a different perspective from which to analyze the price action. Some, such as moving averages, are derived from simple formulas and the mechanics are relatively easy to understand. Others, such as Stochastics, have complex formulas and require more study to fully understand and appreciate. Regardless of the complexity of the formula, technical indicators can provide unique perspective on the strength and direction of the underlying price action. For example, a simple moving average is an indicator that calculates the average price of a security over a specified number of periods. If a security is exceptionally volatile, then a moving average will help to smooth the data. A moving average filters out random noise and offers a smoother perspective of the price action.
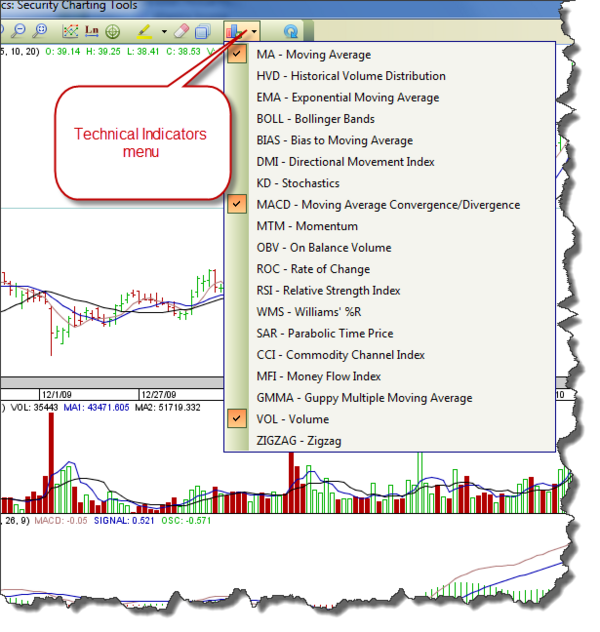
MyMoney supports over 18 technical indicators and oscillators and support for more is planned for the future.
To access Technical Indicators menu functions please press the indicators button on the Investments Charts toolbar, as illustrated below:
Indicators
- MA - Moving Average: Moving averages are used to emphasize the direction of a trend and to smooth out price and volume fluctuations, or "noise", that can confuse interpretation. Typically, upward momentum is confirmed when a short-term average (e.g.15-day) crosses above a longer-term average (e.g. 50-day). Downward momentum is confirmed when a short-term average crosses below a long-term average.
- HVD - Historical Volume Distribution:
- EMA - Exponential Moving Average: A type of moving average that is similar to a simple moving average, except that more weight is given to the latest data. The exponential moving average is also known as "exponentially weighted moving average".
- BOLL - Bollinger Bands: Developed by John Bollinger, Bollinger Bands are volatility bands that are placed above and below a moving average. The moving average represents the average price over a specific period, which smooths the price series. Volatility is based on the standard deviation. Because Bollinger Bands are based on volatility, they automatically adapt to price changes. There are three components to the Bollinger Band indicator:
- Moving Average: By default, a 20-period simple moving average is used.
- Upper Band: The upper band is usually 2 standard deviations (calculated from 20-periods of closing data) above the moving average.
- Lower Band: The lower band is usually 2 standard deviations below the moving average.
- BIAS - Bias To Moving Average:
- DMI - Directional Movement Index: An indicator developed by J. Welles Wilder for identifying when a definable trend is present in an instrument. That is, the DMI tells whether an instrument is trending or not. Directional Movement Index (DMI) consists of two lines, the DMI plus line (DMI+) and the DMI minus line (DMI-), which generate buy and sell signals.


