Investment Charts
From MTHWiki
| Line 97: | Line 97: | ||
| - | *Straight Line: | + | *Straight Line and Straight Line Segment: Use this indicators to draw lines on the chart |
| + | |||
| + | [[Image:Line.png|center|thumb|600px]] | ||
| - | *Straight Line Segment: | ||
=== Indicators === | === Indicators === | ||
Revision as of 21:39, 2 July 2010
Overview
Chart Drawings
MyMoney supports the following predefined drawings:
Fibonacci Sequences:
Fibonacci was actually Leonardo de Pisa, a 13th-century Italian mathemetician who discovered the unique number sequence that bears his name.
Fibonacci numbers are a sequence of numbers in which each successive number is the sum of the two previous numbers: 1, 1, 2, 3, 5, 8, 13, 21, 34, 55, 89, 144, 233, and so on. These numbers interrelate in a variety of ways - for example, any given number is approximately 1.618 times the preceding number and any given number is approximately 0.618 times the following number.
Interpretation of the Fibonacci numbers in technical analysis anticipates changes in trends as prices tend to be near lines created by the Fibonacci studies.
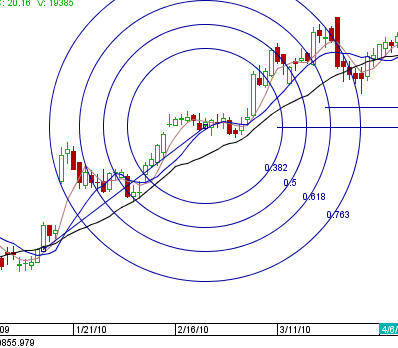
- Fibonacci Arcs: Fibonacci arcs are created by first drawing an invisible trendline between two points (usually the high and low in a given period), and then by drawing three curves that intersect this trendline at the key Fibonacci levels of 38.2%, 50% and 61.8%. Transaction decisions are made when the price of the asset crosses through these key levels.
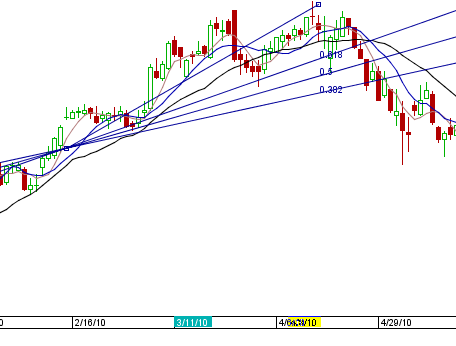
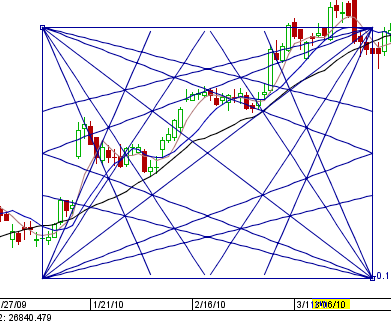
- Fibonacci Fan Lines: Fibonacci fans are created by first drawing a trendline through two points (usually the high and low in a given period), and then by dividing the vertical distance between the two points by the key Fibonacci ratios of 38.2%, 50% and 61.8%. The result of these divisions each represent a point within the vertical distance. The three 'fan' lines are then created by drawing a line from the leftmost point to each of the three representing a Fibonacci ratio.
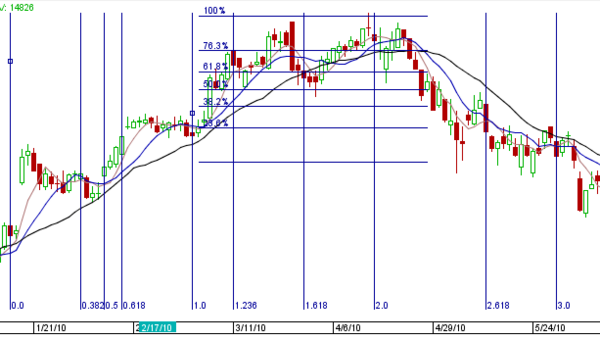
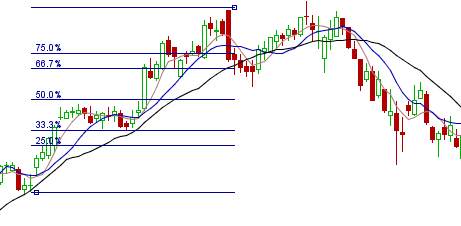
- Fibonacci Horizontal and Vertical Retracements: A term used in technical analysis that refers to the likelihood that a financial asset's price will retrace a large portion of an original move and find support or resistance at the key Fibonacci levels before it continues in the original direction. These levels are created by drawing a trendline between two extreme points and then dividing the vertical distance by the key Fibonacci ratios of 23.6%, 38.2%, 50%, 61.8% and 100%.
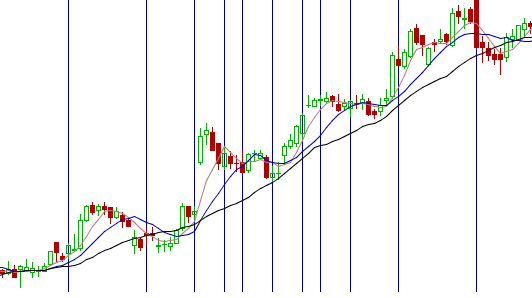
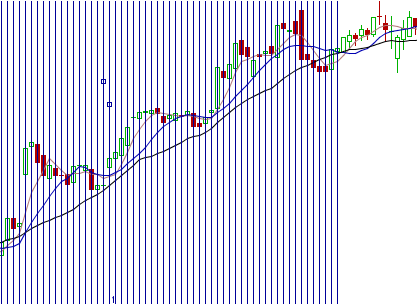
- Fibonacci TimeZones: An indicator used identify periods in which the price of an asset will experience a significant amount of movement. This charting technique consists of a series of vertical lines that correspond to the sequence of numbers known as Fibonacci numbers (1, 2, 3, 5, 8, 13, 21, 34, etc.) Once a trader chooses a starting position (most commonly following a major move) on the chart, a vertical line is placed on every subsequent day that corresponds to the position in the Fibonacci number sequence.
- Gann Angle: A method of predicting price movements through the relation of geometric angles in charts depicting time and price. The ideal balance between time and price exists when prices move identically to time, which occurs when the Gann angle is at 45 degrees. In total, there are nine different Gann angles that are important for identifying trend lines and market actions. When one of these trend lines is broken, the following angle will provide support or resistance
See detailed Gann Theory article on Wikipedia
- Gann Periods: Similar to Fibonacci TimeZones, this indicator will identify periods in which the price of an asset will experience a significant amount of movement. This charting technique consists of a series of vertical lines that correspond to the sequence of numbers identified by Gann periods
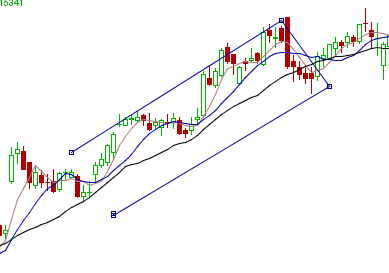
- Parallel Lines: You can place Parallel lines on a chart to identify trendlines, this is commonly used to show direction and speed of price.
- Percent: You can quickly calculate percentages between two point by placing and then dragging Percent indicator on a chart
- Periods: You can break the chart into any number of arbitrary periods by placing and then dragging Periods indicator
- Poly-Straight Line Segment: You can draw a poly line on a chart, for example to highlight a particular period on a chart
- Straight Line and Straight Line Segment: Use this indicators to draw lines on the chart
