Investment Charts
From MTHWiki
Overview
Chart Drawings
MyMoney supports the following predefined drawings:
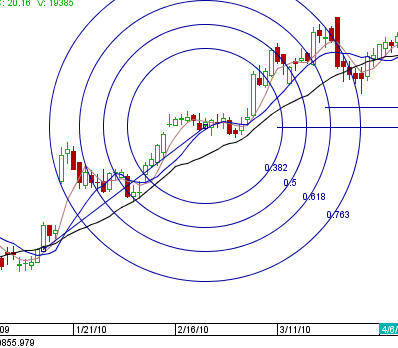
- Fibonacci Arcs: Fibonacci arcs are created by first drawing an invisible trendline between two points (usually the high and low in a given period), and then by drawing three curves that intersect this trendline at the key Fibonacci levels of 38.2%, 50% and 61.8%. Transaction decisions are made when the price of the asset crosses through these key levels.
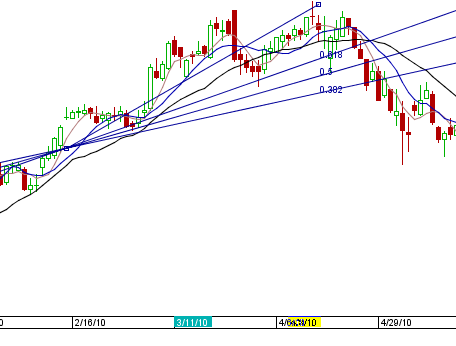
- Fibonacci Fan Lines: Fibonacci fans are created by first drawing a trendline through two points (usually the high and low in a given period), and then by dividing the vertical distance between the two points by the key Fibonacci ratios of 38.2%, 50% and 61.8%. The result of these divisions each represent a point within the vertical distance. The three 'fan' lines are then created by drawing a line from the leftmost point to each of the three representing a Fibonacci ratio.
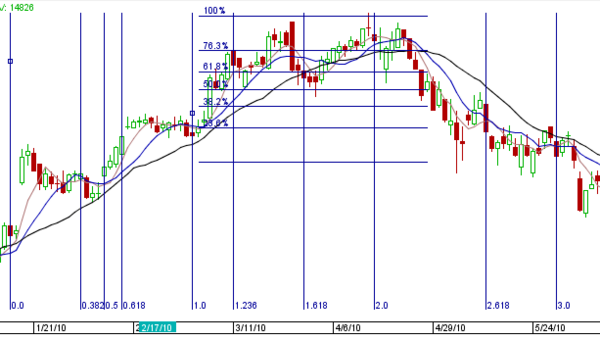
- Fibonacci Retracements: A term used in technical analysis that refers to the likelihood that a financial asset's price will retrace a large portion of an original move and find support or resistance at the key Fibonacci levels before it continues in the original direction. These levels are created by drawing a trendline between two extreme points and then dividing the vertical distance by the key Fibonacci ratios of 23.6%, 38.2%, 50%, 61.8% and 100%.
- Fibonacci TimeZones
- Fibonacci Vertical Retracements
- Gann Angle
- Gann Periods
- Parallel Lines
- Percent
- Periods
- Poly-Straight Line Segment
- Straight Line
- Straight Line Segment


