Analyze your Portfolio
From MTHWiki
| Line 25: | Line 25: | ||
| - | Portfolio Cashflows allows you to quickly visualize inflows and outflows of cash into your Investments. Inflows occur when you sell a an Investment or take a distributed redemption and and outflows occur when you purchase and Investment or incur an investment related expense. | + | Portfolio Cashflows analysis allows you to quickly visualize inflows and outflows of cash into your Investments. Inflows occur when you sell a an Investment or take a distributed redemption and and outflows occur when you purchase and Investment or incur an investment related expense. |
Inflows are marked in shades of blue and outflows are marked in shaded of red. The different parts of cash movements are weighted and given the shades of color so it is easy to identify them visually. | Inflows are marked in shades of blue and outflows are marked in shaded of red. The different parts of cash movements are weighted and given the shades of color so it is easy to identify them visually. | ||
| Line 41: | Line 41: | ||
| + | Portfolio Composition analysis visualizes the portfolio structure over time. Similar to other visualizations, you can sort the display of Securities by kind (Bonds/Stocks/Mutual Funds/etc), Date periods and by different Security criteria, such as funded, name, etc. | ||
Revision as of 18:05, 2 July 2010
Overview
MyMoney portfolio analysis provides expanded information about your portfolio (or a portion of your portfolio) by:
- Giving both graphical and holdings views of your account assets
- Showing your asset allocation, foreign and domestic stock exposure, and industry weightings
- Mapping your equity holdings style
- Detailing some historical information about how your current asset mix has performed over certain periods of time
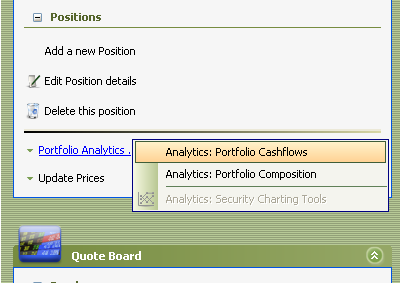
To access Portfolio Analytics functions please use the Portfolio Tools -> Portfolio Analytics menu
Portfolio Cashflows
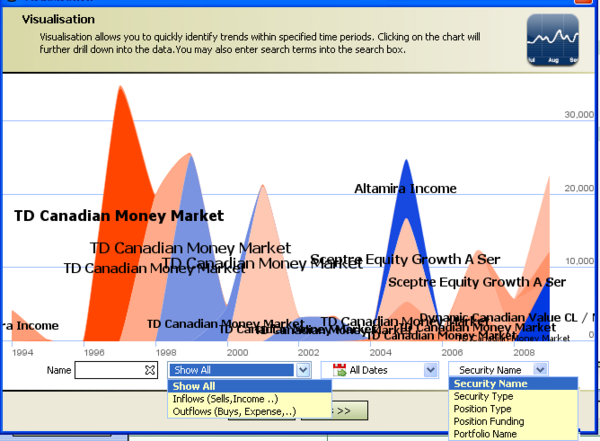
Portfolio Cashflows analysis allows you to quickly visualize inflows and outflows of cash into your Investments. Inflows occur when you sell a an Investment or take a distributed redemption and and outflows occur when you purchase and Investment or incur an investment related expense.
Inflows are marked in shades of blue and outflows are marked in shaded of red. The different parts of cash movements are weighted and given the shades of color so it is easy to identify them visually.
You can sort the display of data by its kind (Inflows/Outflows), Date periods and by different Security criteria, such as to which Portfolio it belongs, how it was funded, name, etc.
In addition, you can zero-in on a security by typing in its name in the name filter field. The same effect could be accomplished by simply clicking on a flow anywhere on a chart, the name will by typed into the name filter field automatically. To undo this filtering please click on a red X in the name filter field.
Portfolio Composition
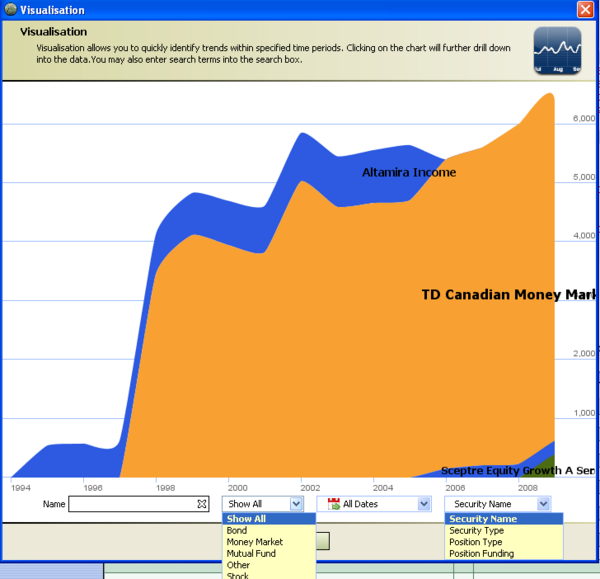
Portfolio Composition analysis visualizes the portfolio structure over time. Similar to other visualizations, you can sort the display of Securities by kind (Bonds/Stocks/Mutual Funds/etc), Date periods and by different Security criteria, such as funded, name, etc.


